Compare 5 Smart Beta ETFs by Expense Ratio
When a client slides across the table a printout comparing their current S&P 500 index fund at 0.03% against a multi-factor smart beta ETF at 0.35% and asks, "Why am I paying ten times more?", you need more than a shrug and a pitch deck.
The Fee Conversation You Can't Avoid
The reality is that expense ratios in the smart beta universe span a meaningful range — from roughly 0.20% on the lower end to north of 0.60% for more complex, multi-factor or niche implementations — and that spread exists for structural reasons every advisor should be able to articulate clearly. If you can't walk a client through exactly what they're paying for and why, you've already lost the conversation.
How Smart Beta Fee Structures Actually Work
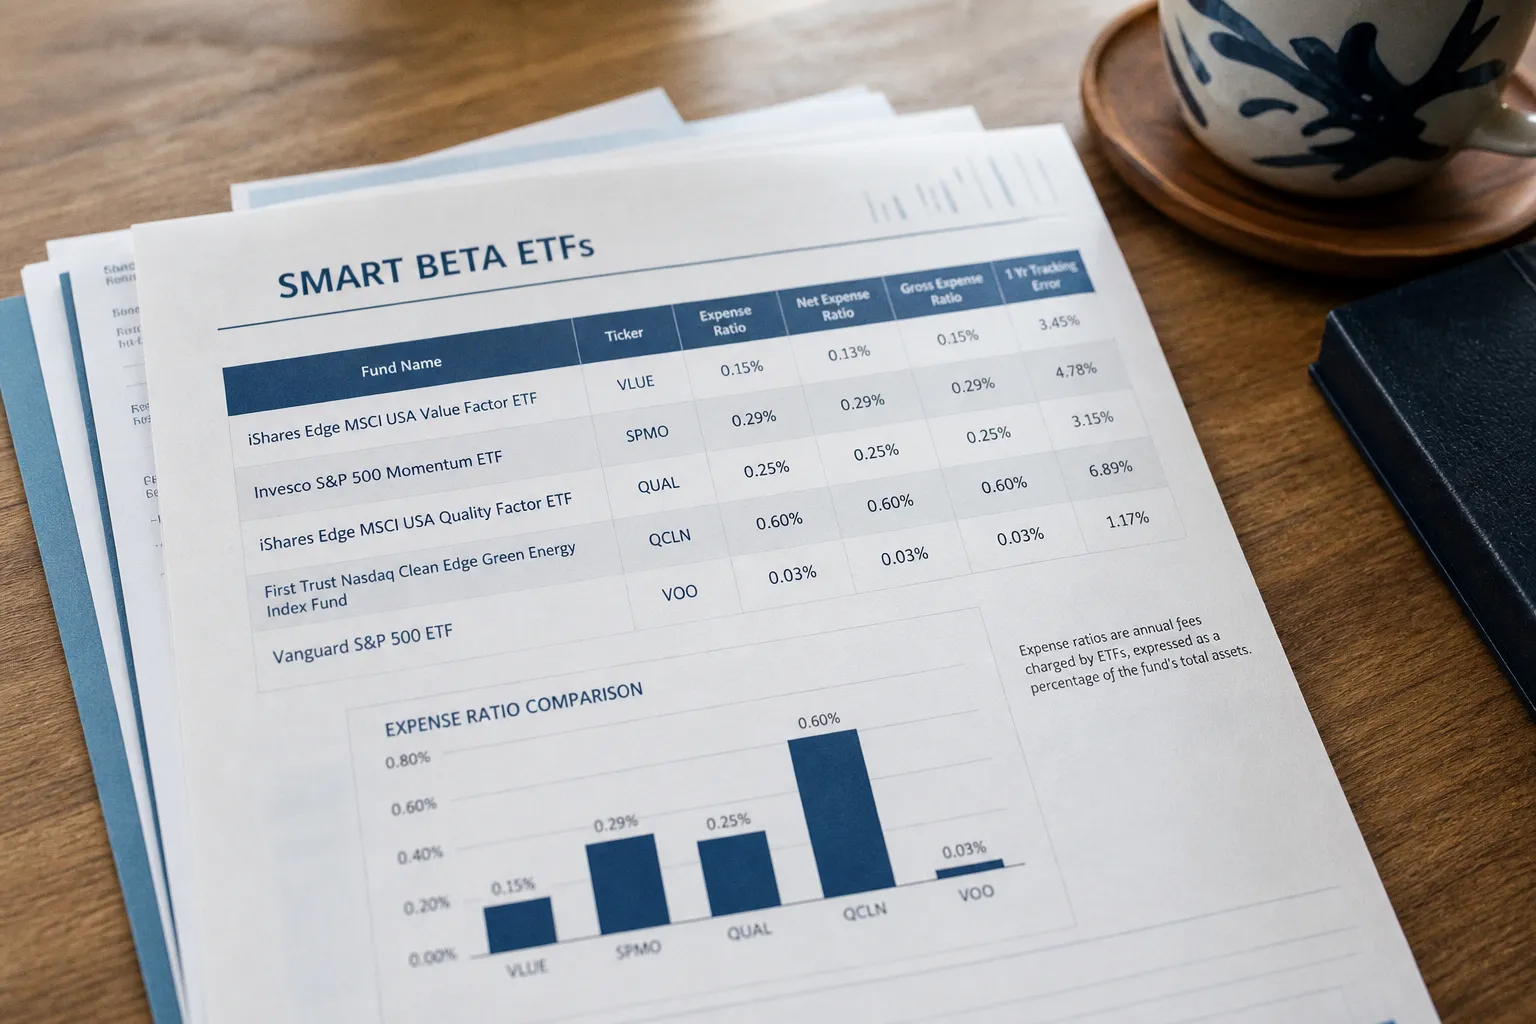
The expense ratio — the annual fee an ETF charges as a percentage of total assets under management — covers management, administration, and operational costs. For a straightforward market-cap-weighted index fund, those costs are minimal: the fund tracks a rules-based index, rebalances on a predictable schedule, and requires relatively little active research input. That's why you see expense ratios routinely below 0.10%.
Smart beta is different by design. These funds don't simply mirror the market's weighting by capitalization. They tilt toward specific factors — value, momentum, quality, low volatility, dividend yield, or some combination — and that tilt requires ongoing research, more frequent or complex rebalancing, and portfolio construction that goes beyond replicating an index. The cost structure reflects that added complexity.
Here's where the fiduciary reality sharpens: those higher fees are not arbitrary. They represent real analytical work — the kind of factor research, back-testing, and systematic rebalancing that, in a traditional active mutual fund, would command fees of 0.75% to 1.50%. Smart beta occupies a deliberate middle ground, and understanding that positioning is step one in any client conversation about cost.
The question isn't whether smart beta costs more than a plain index fund — it does. The question is whether the factor exposure and implementation quality justify the delta over your client's investment horizon.
Why Factor-Based Strategies Command a Premium
Let's be specific about what you're paying for. A value-tilted smart beta ETF doesn't just buy stocks that look cheap on a screen. It applies systematic rules — earnings-to-price ratios, book-to-market metrics, cash flow yields — rebalances at defined intervals, and manages the turnover and tax implications of that rebalancing. A momentum factor fund is continuously evaluating relative strength signals and repositioning accordingly. A quality factor screen filters for profitability, earnings stability, and low leverage — all of which require data processing and rule enforcement that a cap-weighted index simply doesn't need.
The premium breaks down roughly into three buckets:
- Research and methodology development. Factor construction — defining what "value" or "quality" means, weighting multiple sub-factors, stress-testing the model — is upfront intellectual work with ongoing maintenance costs.
- Rebalancing complexity. Smart beta funds typically rebalance more frequently and with more rules-driven nuance than a passive index, generating higher trading costs that flow into the expense ratio.
- Portfolio construction. Combining factors (multi-factor ETFs) or applying constraints (sector caps, liquidity screens, ESG overlays) adds layers of systematic decision-making that increase operational overhead.
None of this is speculative. The CFA Institute and Morningstar have both published extensively on the cost mechanics of factor investing, and the data is consistent: smart beta ETFs typically carry expense ratios in the 0.20% to 0.60% range, depending on complexity. Single-factor, rules-based strategies sit at the lower end; multi-factor or alternative-weighting approaches push toward the higher end. The key figures are straightforward, and advisors who internalize them can frame the cost discussion with confidence.
The Right Way to Compare: Standardized Tools and Consistent Metrics
Here's the practical challenge that trips up even experienced advisors: expense ratios are not self-interpreting. You can't line up five smart beta ETFs, pick the lowest fee, and declare a winner. The comparison only works when you normalize for factor exposure, methodology, and — critically — tracking error.
Tracking error measures how much a fund's returns deviate from its stated benchmark. A smart beta fund with a value tilt is supposed to deviate from the S&P 500 — that's the whole point. But the magnitude and consistency of that deviation tells you whether the implementation is efficient or sloppy. A fund with a 0.25% expense ratio and a 3.5% tracking error may be delivering less value than a fund at 0.40% with a tighter, more intentional tracking pattern relative to its factor benchmark. The cost-per-unit of realized factor exposure — that's the number worth optimizing for, not the expense ratio in isolation.
For standardized comparisons, the tools are accessible and well-established:
1. SEC's EDGAR database. Every registered ETF files standardized fee disclosures here. This is the regulatory baseline — gross and net expense ratios, fee waivers, and reimbursement schedules are all publicly available. The filings also include the fund's prospectus, which details the specific methodology and any constraints applied during portfolio construction.
2. Morningstar. Their fund comparison tools allow side-by-side expense ratio analysis alongside category averages, historical performance, and — importantly — risk-adjusted return metrics like Sharpe ratio and information ratio relative to the fund's factor benchmark. Morningstar's category system also ensures you're comparing funds operating in the same factor space rather than conflating single-factor and multi-factor strategies.
3. ETF.com. Provides detailed cost breakdowns, including trading costs and tax efficiency data that the headline expense ratio alone doesn't capture. The site's fund flow and liquidity data can also flag whether a fund is gaining or losing assets — a relevant signal for whether a temporary fee waiver is likely to persist or expire.
When you sit down with a client and pull up three or four smart beta options, the discipline is to compare apples to apples: same factor category, similar methodology, and expense ratios evaluated alongside tracking error and net-of-fee performance. A table makes this tangible.
| Metric | Low-Cost Single Factor | Mid-Range Multi-Factor | Complex Alternatives |
|---|---|---|---|
| Typical expense ratio | 0.20%–0.30% | 0.30%–0.45% | 0.45%–0.60%+ |
| Factor exposure | Single tilt (e.g., value OR momentum) | Combined (e.g., value + quality + momentum) | Alternative weighting, niche factors |
| Rebalancing frequency | Quarterly or semi-annual | Monthly or rule-triggered | Dynamic, continuous |
| Tracking error profile | Lower, more predictable | Moderate, layered | Higher, methodology-dependent |
| Best suited for | Targeted factor conviction | Diversified factor allocation | Sophisticated mandates, institutional |
This kind of comparison — grounded in real cost ranges and implementation characteristics — gives the client a framework rather than a sales pitch. It respects their intelligence and your fiduciary obligation simultaneously.
The Gross vs. Net Distinction Matters More Than You Think
One detail that routinely gets glossed over in advisor-client conversations is the difference between gross and net expense ratios. The gross expense ratio reflects the full cost of operating the fund before any temporary fee waivers or reimbursements. The net expense ratio is what investors actually pay after those adjustments.
Why does this matter? Because many smart beta ETFs — particularly newer ones competing aggressively for assets under management — launch with temporary fee waivers to make their headline expense ratio more attractive. Those waivers have expiration dates. When they lapse, the net expense ratio can jump meaningfully, and the client who chose a fund partly on cost grounds is suddenly paying more than they expected.
This isn't hypothetical. It's a pattern that plays out regularly when smart beta ETFs from different issuers go head-to-head for market share. An issuer launches at a promotional net expense ratio of 0.20%, attracting flows away from a competitor at 0.30%. Two years later, the promotional waiver expires and the net ratio reverts to the gross — sometimes 0.40% or higher. The client never saw it coming because nobody walked them through the fine print.
A temporary fee waiver isn't a pricing strategy — it's a marketing one. When you're evaluating smart beta ETFs for a long-term allocation, always check the gross expense ratio. That's the number that survives once the promotional period ends.
The practical step is simple: when comparing funds, note both the gross and net expense ratios side by side. If there's a significant gap — say, a gross ratio of 0.45% against a net of 0.30% — ask what triggers the fee reduction and when it expires. Morningstar and SEC filings both disclose this information, and incorporating it into your analysis protects both you and your client from a future surprise that erodes the trust you've built.
Balancing Cost Efficiency Against Factor Exposure
Here's where the conversation moves from mechanics to judgment — and where your advisory value truly differentiates itself. The cheapest smart beta ETF is not automatically the best choice. The most expensive one isn't inherently superior. The right fund depends on what your client actually needs from the allocation and how the factor exposure aligns with their broader portfolio context.
Consider two common scenarios you'll encounter in practice:
Scenario one: A client with a core passive allocation seeking a modest value tilt. Here, a low-cost single-factor value ETF at 0.22% may be entirely sufficient. The factor exposure is straightforward, the tracking error relative to a value benchmark is predictable, and the cost delta versus a plain index fund is defensible over any reasonable time horizon. You don't need to pay 0.50% for a multi-factor wrapper when a single, clean tilt does the job.
Scenario two: A client with a longer investment horizon and a mandate to diversify across multiple return drivers. A multi-factor smart beta ETF at 0.38% — combining value, momentum, quality, and low volatility — delivers a more diversified factor profile that a single-factor fund can't replicate. The higher expense ratio buys genuine implementation breadth, and over a ten- to fifteen-year horizon, the incremental cost is modest relative to the potential diversification benefit.
There's also a third scenario worth considering: the client who already has factor exposure embedded elsewhere in their portfolio. If their active equity allocation already tilts toward quality and momentum through a concentrated stock-picking strategy, layering a multi-factor smart beta ETF on top creates duplication they're paying for twice. In that case, the most cost-efficient smart beta allocation might be a single-factor fund filling the one gap they don't already have covered — or no smart beta allocation at all.
The fiduciary reality is that expense ratio comparison without portfolio context is a hollow exercise. When you frame the cost discussion inside the client's actual allocation — their existing holdings, their factor exposures, their tax situation, their time horizon — the expense ratio becomes one input among several, not the sole decision criterion.
What to Tell Clients — and What to Keep to Yourself
The final layer of this conversation is the most human one: how you actually deliver the message. Clients don't want a lecture on factor methodology. They want to understand — in plain terms — what they're paying and why it's reasonable.
The framework we've found most effective keeps it to three points:
1. "You're paying for research and rules, not a manager picking stocks." Smart beta isn't traditional active management. It's systematic, rules-driven, and transparent. The cost reflects implementation complexity, not subjective judgment calls.
2. "The fee range is meaningful — 0.20% to 0.60% — and the difference matters over time." Be direct about the spread. A 0.40% annual fee difference on a $500,000 allocation compounds to real money over a decade — roughly $20,000 in cumulative drag before accounting for any differential in returns. Show the math if they're interested. Don't show the math if they're not — but know the numbers cold so your conviction reads as earned, not rehearsed.
3. "I'm comparing fees alongside tracking error and factor fit, not just picking the cheapest option." This positions you as a fiduciary doing real work — not just a cost minimizer — and it's the truth. A fund with a slightly higher expense ratio that delivers cleaner, more consistent factor exposure is often the better choice for a long-horizon allocation.
What you keep to yourself is the noise: marketing claims about "revolutionary factor construction," promotional fee waivers that obscure long-term cost, and any temptation to treat expense ratio as a standalone virtue signal. The clients who trust you most are the ones who sense you're filtering signal from noise on their behalf — not just passing through whatever the fund sponsor's pitch deck says.
The bottom line for advisors navigating the smart beta cost conversation is this: expense ratios are necessary data, but they're not sufficient analysis. Factor exposure quality, tracking error behavior, gross-versus-net fee transparency, and alignment with the client's actual portfolio needs — that's the full picture. When you can articulate all of that in a single client meeting, you've moved beyond fee comparison into genuine portfolio counsel. And that's where the relationship — and the retention — holds.